Public relations reporting is how we measure, break down, and share the results of our PR work and show its effect on business goals. It's about turning a pile of data into a story of success that shows how your PR efforts are shaping brand reputation, bringing people to your website, and even helping to make sales.
Why Modern Public relations Reporting Matters
Let’s be honest, the days of printing out press clippings and stacking them on the boss's desk are long gone. Today's leaders don't just want to see that you're busy; they want to see how your work hits the bottom line.
This is where modern public relations reporting really proves its worth. It’s the essential link between your team’s day-to-day grind and the results the C-suite actually cares about: growth, market share, and revenue.
Having a solid reporting system isn't just a 'nice-to-have' anymore. It's your ticket to survival and a must-have for any communications pro. It's the proof you bring when asking for more budget. It's the compass that helps you refine your campaign strategies. And most importantly, it's what gets you a seat at the big table where decisions are made.
From Activity to Impact
The biggest change in PR has been the move away from just celebrating activity to actually proving impact. Nobody gets excited about a report that's just a long list of media mentions. Stakeholders have bigger questions.
- Did our key messages actually get through? A good report tracks how well your core messages appeared in the coverage, not just if your brand was named.
- Did we connect with the right people? It’s not about how big the publication's audience is, but whether it’s the right audience for your brand.
- What was the real business outcome? Did that big feature in a top-tier outlet actually drive referral traffic, generate leads, or give our SEO a boost?
A great report doesn't just present data; it tells a story. It crafts a compelling narrative of success that resonates from the marketing team all the way to the board room, turning metrics into a powerful case for PR's value.
A Strategic Imperative
This shift is all about PR becoming more connected with the wider marketing world. When you can draw a straight line from a single thought leadership piece to a 15% increase in high-quality inbound leads, you're speaking a language everyone understands. When you can show that a series of targeted media placements boosted organic search traffic by 20%, you completely change the conversation.
You're no longer seen as just a cost center; you become a driver of growth. If you need a refresher on PR's core role here, take a look at what PR stands for in business to get the full picture.
Ultimately, great PR reporting is about more than just proving your worth. It’s about making your work smarter, more focused, and more valuable to the entire company. It’s the engine that turns good PR into brilliant business strategy.
A report is only as good as the goals it’s built on. It's easy to get lost in a sea of vanity metrics, but your public relations reporting has to connect your team's hard work to what actually moves the needle for the business. This isn't just about counting mentions; it’s about proving your strategic value.
The whole game is about linking your day-to-day PR work to solid data, which in turn proves you’re driving business growth. Without that connection, you’re just handing over a list of tasks.
This flowchart breaks it down beautifully:
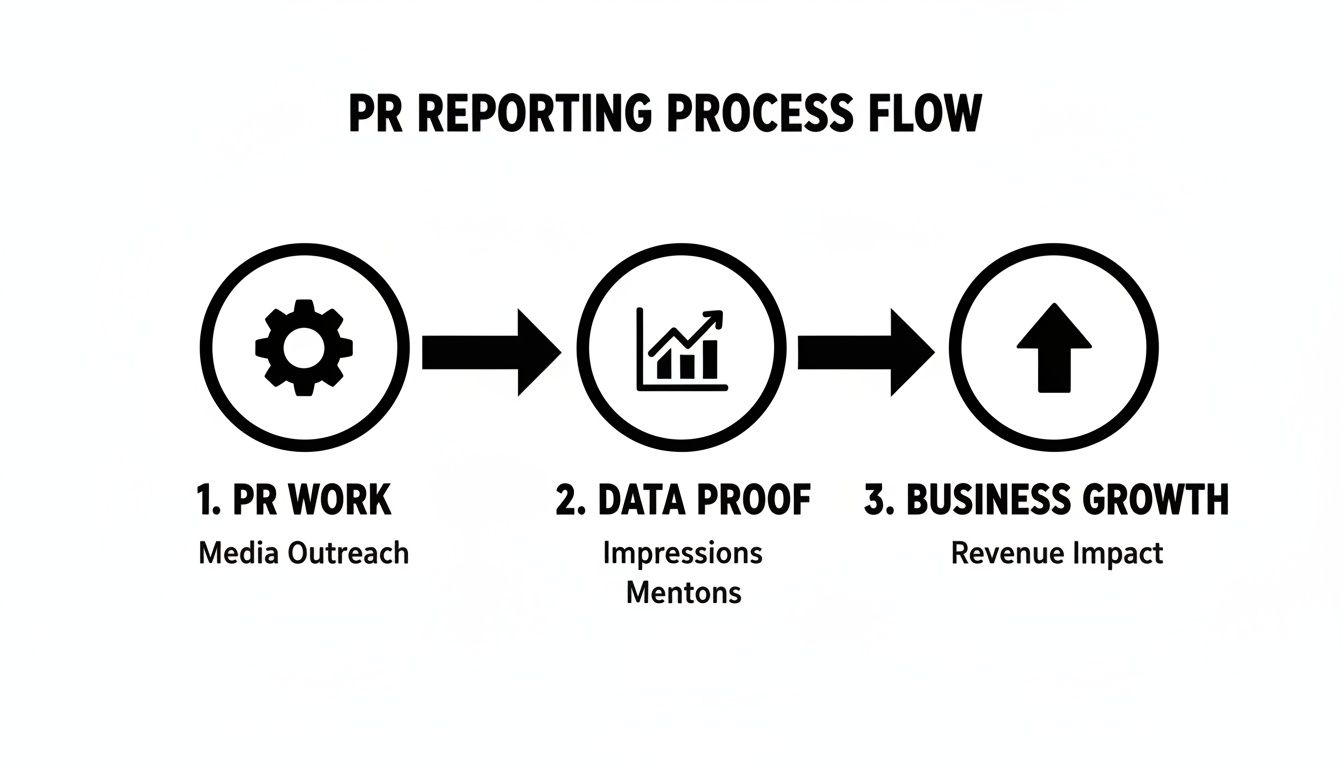
Think of it this way: your PR work is the engine, data is the fuel, and business growth is the destination. Your report is the dashboard showing how it all works together.
H3: Setting Goals That Actually Resonate
Before you even think about tracking a single KPI, you need to ask one fundamental question: "What does the business need to achieve?" The answer is your North Star, defining every PR objective you set.
Are you trying to make a new product fly off the shelves, build up a founder's public profile, or navigate a tricky reputation issue? Each scenario demands a completely different playbook and set of goals.
For a new product launch, the main business objective is almost always revenue. So, your PR goal becomes generating awareness that directly funnels into sales. If you're building a founder's profile to attract investors, your PR goal shifts to securing placements in the high-authority business publications those investors are reading.
A report that starts with business objectives automatically answers the 'So what?' question before it's even asked. It shifts the conversation from 'what you did' to 'what you accomplished'.
This strategic mindset is no longer optional. The global PR market is set to hit $129 billion by 2026, largely because it's so intertwined with marketing in the fight for online visibility. But with journalists only responding to about 3% of pitches, the pressure is on to prove ROI with data. You can find more stats on these PR trends from Avaans Media.
H3: Matching KPIs to Your Campaign Objectives
Once your goals are crystal clear, you can finally pick the key performance indicators (KPIs) that matter. It's time to graduate from simply counting mentions and start using metrics that tell a compelling story of influence and impact.
One of the most common traps is applying a one-size-fits-all set of KPIs to every single campaign. The metrics you'd use for a crisis communication blitz are worlds apart from what you’d track for a long-term brand-building initiative.
To avoid this, you need to deliberately map your KPIs to your specific campaign goals. The table below provides a simple framework for matching common PR goals with the right metrics, ensuring you're always focused on what drives business success.
| Matching PR Goals to Key Performance Indicators (KPIs) |
| :— | :— | :— | :— |
| Campaign Goal | Primary KPIs | Secondary KPIs | What It Measures |
| Brand Awareness | Media Impressions, Share of Voice (SOV), High-Authority Media Mentions | Social Media Engagement, Website Traffic Increase | Your message's reach and visibility in the market compared to competitors. |
| Lead Generation | Website Referral Traffic, Leads from PR Content, Conversion Rate | Gated Content Downloads, Demo Requests | The direct impact of PR activities on the sales and marketing funnel. |
| Reputation Management | Sentiment Analysis (Positive/Negative/Neutral), Message Pull-Through | Decrease in Negative Mentions, Increase in Positive SOV | Public perception of your brand and the effectiveness of your messaging. |
| Thought Leadership | Key Message Penetration, High-Tier Media Placements, Speaking Engagements | Executive Profile Mentions, Contributed Article Placements | Your brand's authority and influence within its industry. |
By being selective and strategic with your KPIs, you're not just creating a report; you're building a business intelligence tool. Each metric has a purpose and contributes to a powerful narrative that shows PR isn't a cost center—it's a growth driver.
Gathering Data for Meaningful Analysis

Alright, you’ve got your goals locked in. Now it’s time to roll up your sleeves and get the raw materials for your report. This isn't just about collecting a bunch of links. We're moving on to building a proper dataset you can actually use for strategic analysis.
Think of it this way: you’re a detective building a case. You need the hard evidence and the witness statements to tell the whole story. For public relations reporting, that means tracking everything from a major feature in Forbes down to a mention on a niche podcast with equal precision.
Differentiating Your Data Types
First things first, you need to sort your findings into two buckets. This simple organizational step will make your life so much easier when it's time for analysis.
-
Quantitative Data: This is the "what." It's all the measurable stuff—the numbers that show your reach and activity. We're talking media impressions, referral clicks from an article, social media shares, and the number of backlinks you earned. These metrics are straightforward and perfect for tracking progress over time.
-
Qualitative Data: This is the "so what." It adds the color and context that numbers alone just can't provide. This includes things like sentiment analysis (was the coverage positive?), message pull-through (did they include our key talking points?), and the prominence of the mention (was it a headline or a quick name-drop?).
Capturing both data types is non-negotiable. A report with only quantitative data shows activity but misses the story of influence. A report with only qualitative insights feels subjective and lacks the hard proof executives need. The magic happens when you combine them.
For example, knowing you secured 10 media placements is solid quantitative data. But knowing that 8 of those 10 placements were glowing in sentiment and included two of your three key messages? That's the powerful qualitative insight that tells a compelling story.
Streamlining Collection with Media Monitoring
Let’s be real: manually searching the entire internet for every mention is a one-way ticket to burnout. This is where media monitoring platforms become your best friend. Tools like Muck Rack, Cision, or Meltwater automate the whole discovery process.
These platforms are the engine of modern public relations reporting. You can set up alerts for your brand, your CEO, key industry topics, and even your competitors. They don’t just find the coverage; they often provide a first pass at analysis, like estimated reach and automated sentiment scores.
The tech in this space is moving fast. According to Muck Rack's 2026 State of PR Measurement Report, a whopping 61% of PR pros now use AI for tasks like sentiment analysis. It frees us up to focus on strategy instead of grunt work. In fact, 85% of pros now prefer digital metrics that tie directly back to business results. You can read the full research on PR measurement from Muck Rack to see how things are shifting.
Building Your Master Dataset
Whether you're using a high-end platform or a simple setup with Google Alerts, you need one central place to organize all your findings. This is usually a spreadsheet, and it becomes the single source of truth for your entire report.
Create columns for every data point you want to track. At a minimum, you should have:
- Date of Publication
- Outlet Name
- Article Title & Link
- Journalist/Author
- Outlet Tier (e.g., Tier 1, 2, 3)
- Sentiment (Positive, Neutral, Negative)
- Key Message Pull-through (Yes/No)
- Impressions/UVMs
- Backlink Included (Yes/No)
- Referral Traffic (from Google Analytics)
Having this structured data is a game-changer for efficiency. When you're dealing with big campaigns, knowing how to generate reports from Excel data can save you hours. An organized dataset lets you pivot, filter, and visualize your results to spot trends you'd otherwise miss. If you want to dive deeper into connecting PR efforts to real outcomes, you might find our guide on tracking and measuring the success of your press releases helpful.
How to Measure Real PR Impact
This is where the rubber meets the road. We're moving beyond just counting clips and into the metrics that really matter to the C-suite. The goal is to connect all your team’s hard work directly to business value, building an undeniable case for PR's role in the company's success.
To do that, we need to dig into the numbers that show how public relations shapes your market position, builds brand authority, and even drives sales. We'll focus on three heavy-hitters: Share of Voice (SOV), Earned Media Value (EMV), and the often-overlooked impact on SEO.
When you bring these metrics together, you shift the conversation entirely. It’s no longer about, "How many articles did we get?" Instead, you're answering, "How did PR move the needle for the business?"
Calculating Your Share of Voice
Think of Share of Voice (SOV) as your brand's slice of the conversational pie within your industry. It's a powerful competitive metric that answers a simple question: "When people talk about our market, how often are they talking about us versus our rivals?"
A high SOV is a clear indicator of market leadership and strong brand recall. To figure it out, you'll first need to use your media monitoring tools to define your competitive landscape and the core topics that matter.
First, track the total number of mentions for your brand over a set period, like a quarter. Then, do the exact same thing for your top three to five competitors. The formula is refreshingly simple: (Your Brand Mentions / Total Industry Mentions) x 100.
Let's say your brand got 50 mentions last quarter. Your three main competitors racked up 75, 40, and 35 mentions, respectively. That puts the total industry mentions at 200. Your SOV would be (50 / 200) x 100 = 25%. Now you have a concrete, competitive benchmark to show leadership.
The Modern Approach to Earned Media Value
Let’s be honest, Earned Media Value (EMV) has a bit of a checkered past. The old-school method of slapping an advertising dollar value on press coverage was, frankly, nonsense. It was rightly called out for being inflated and meaningless. Today, our approach is much smarter and far more defensible.
Modern EMV isn't about pulling a fictional dollar figure out of thin air. It’s about creating a consistent way to compare the relative value of different pieces of coverage. It helps you answer questions like, "Was that feature in TechCrunch really more impactful than those ten placements in smaller trade publications?"
A modern EMV calculation should be a weighted score based on factors that matter to your business. It's less about a final dollar figure and more about creating a consistent 'value score' to compare the impact of different media placements over time.
For instance, you can build your own custom scoring system that aligns with your goals:
- Outlet Authority: A placement in a Tier 1 outlet like the Wall Street Journal gets 10 points.
- Sentiment: Positive coverage gets 5 points.
- Backlink: A dofollow link back to your site is worth 5 points.
- Key Message Pull-Through: Mention of a core talking point earns 3 points.
A piece of coverage that scores a 23 is clearly more valuable to the business than one that only scored a 5. This gives you a data-backed method for evaluating your media relations wins. To truly understand the value of your public relations efforts, you need robust ways to learn how to actively and strategically measure reporting effectiveness using Excel and AI.
Proving Your SEO and Traffic Contribution
This is where your PR report becomes the marketing team’s secret weapon. Every high-quality article that includes a backlink to your website is SEO gold. Proving this connection is one of the most powerful ways to show a direct return on investment.
Your PR reporting absolutely must include SEO metrics. It not only proves your worth but also builds a stronger, more collaborative relationship with your digital marketing counterparts.
Start by tracking these three critical areas:
- Backlink Acquisition: Keep a running list of every earned media placement that links back to your website. Each link from a reputable source is a vote of confidence in Google's eyes, directly boosting your site's authority and search rankings.
- Referral Traffic: Dive into Google Analytics. Head over to
Acquisition > Traffic Acquisitionand filter by the "Session default channel group" to see your "Referral" traffic. From there, you can pinpoint which articles are sending the most visitors to your site. - Lead Conversion: Now for the final step. In Google Analytics, you can see if that referral traffic is actually converting. Is it leading to demo requests, contact form fills, or resource downloads? This directly connects a specific article to a tangible lead for the sales team.
Imagine showing your CEO that a single thought leadership piece you placed not only got 50,000 views but also drove 1,200 referral visits and 30 qualified leads. That’s how you prove indisputable PR impact. If you want to explore more about which metrics to focus on, our article on press release KPIs can provide further guidance.
Crafting Your Report as a Compelling Story

Let’s be honest: data on its own is just noise. It doesn’t tell a story until you give it a voice. After you’ve pulled all your metrics, the real work begins—weaving that data into a narrative that actually means something. A great public relations reporting document isn't a data dump. It’s a strategic tool that spotlights your wins, gets real about challenges, and charts the course for what’s next.
The mission is simple: create a report that people want to read. One they can actually use. This means building a clear story, using visuals to break down the numbers, and always, always tailoring the message to who’s reading it.
The Power of an Executive Summary
Your most important audience—your leadership team—is also your busiest. The executive summary is your shot to cut through the noise and show them the bottom-line impact of your work. It needs to be the very first thing they see and fit on a single page. No exceptions.
This isn't just a warm-up; it's the entire story in miniature. You have to be direct, punchy, and laser-focused on the business outcomes your PR efforts delivered.
To make your executive summary land with impact, build it around these pillars:
- Lead with the knockout win: What’s the single most impressive result you achieved? Start there.
- Tie it back to business goals: Don't make them connect the dots. Explicitly show how your work fueled objectives like lead generation, brand awareness, or share of voice.
- Flash the top-line KPIs: Use your most important numbers and a clean chart to show progress at a glance.
- Give strategic recommendations: End with a clear "what's next." Based on these results, what should the business do?
Think of it as the trailer for your movie. It should give executives everything they need to know, even if they never watch the whole film.
Building a Detailed Tactical Breakdown
While your execs want the 30,000-foot view, your team needs to be on the ground. The tactical breakdown is the body of your report, where you lay out the granular data that explains how you got the results in the summary.
This is where you get into the nitty-gritty of campaign performance, media placements, and audience engagement. It's a transparent look under the hood that helps everyone learn and get better. We all know securing earned media is tough—a staggering 72% of PR professionals say low journalist response rates are their biggest headache. That fact alone makes every single placement a win worth analyzing. It's also why 77% of PR pros are turning to generative AI to craft smarter pitches. You can discover more insights from Muck Rack's latest report on the state of PR.
A strong tactical summary doesn't just list what happened. It provides context, interprets the data, and offers clear takeaways that help the team refine its approach for the next campaign. It’s about building institutional knowledge.
Organize this section logically, maybe by campaign or by goal. Use subheadings, bullet points, and short paragraphs to keep it scannable. Be sure to include links to the actual coverage and add your analysis on why some pieces popped off while others didn't.
Using Visuals to Tell Your Story
A spreadsheet full of numbers is intimidating. Those same numbers in a clean chart can create an "aha!" moment in seconds. Visuals aren't just there to make your report look pretty; they're critical for making your data understandable and memorable.
You should sprinkle a variety of charts and graphs throughout your report to illustrate key points. A dashboard built in a tool like Looker Studio, for example, can pull multiple KPIs into one easy-to-digest view.
Here are some of my go-to visuals for public relations reporting:
- Bar Charts: Perfect for comparisons. Think Share of Voice against your top three competitors or the number of placements by media tier.
- Line Graphs: The best way to show trends over time. Use them to track the growth of media mentions or website referral traffic month-over-month.
- Pie Charts: Great for showing the composition of something, like the sentiment breakdown (positive, neutral, negative) of your coverage.
- Tables: The workhorse for presenting detailed, organized data. This is where your master list of media placements and all their associated metrics lives.
When you turn raw data into a compelling story with sharp summaries and smart visuals, you make sure your insights don't just get seen—they get acted on.
Answering Your Top PR Reporting Questions
Even the best-laid reporting plans run into tricky real-world questions. You're building your dashboard, pulling data, and suddenly you hit a snag. It happens to all of us.
Let's tackle some of the most common hurdles PR pros face when they move from theory to practice. Here are the straight-up answers to the questions we hear all the time.
How Often Should I Create a PR Report?
There’s no single right answer, but there is a right rhythm for your stakeholders and your campaign intensity. The key is to match your reporting cadence to the speed of the action.
For the big moments—a product launch, a major event, or a crisis situation—you need to be reporting weekly or even daily. This isn't about creating extra work; it's about providing the rapid-fire insights needed to make smart, on-the-fly adjustments and keeping leadership in the loop.
For your steady, long-term brand-building or thought leadership campaigns, a monthly report is usually the sweet spot. This gives you enough time to gather data that shows meaningful trends without drowning everyone in information. It also aligns perfectly with tracking progress toward quarterly goals.
Regardless of your weekly or monthly cadence, every PR team must produce a comprehensive Quarterly Business Review (QBR). This is non-negotiable. It’s your strategic, high-level look at performance, connecting results directly to business objectives and setting the stage for the next quarter.
The most important thing? Consistency. When leadership knows to expect your report on the first Monday of the month, it becomes a valued and anticipated part of the business intelligence cycle. You can also give key stakeholders access to a real-time dashboard for those who want to check in more often.
What Are the Best Free Tools for PR Reporting?
You don’t need a massive budget to build a powerful reporting machine. In fact, you can get surprisingly far with a handful of free tools, especially if you’re willing to roll up your sleeves and connect a few dots manually.
Here's a simple, no-cost stack that will cover most of your bases:
- Google Analytics: This is your source of truth. It's essential for tracking referral traffic from media placements and seeing what visitors do once they land on your site.
- Google Alerts: The old reliable for basic media monitoring. Set up alerts for your brand, executives, products, and key industry terms. It’s a fantastic starting point.
- Native Social Media Analytics: Don't sleep on the data inside LinkedIn, X (formerly Twitter), and Meta. These platforms offer a goldmine of information on engagement, reach, and audience demographics for any coverage you share.
- Google Sheets & Looker Studio: This is your command center. Use Google Sheets to consolidate all the data you’ve gathered. Then, plug it into Looker Studio (the new name for Google Data Studio) to create custom, shareable dashboards with beautiful data visualizations.
How Do I Report on a Campaign With Few Media Placements?
First, take a breath. A quiet campaign isn’t automatically a failed one, and your report can still tell a compelling and strategic story. When the earned media clips are few and far between, you simply shift the focus from outcomes to process and learnings.
Start by reporting on your outreach metrics. How many journalists did you pitch? What were your email open and response rates? This isn't just filler; it’s valuable data that shows the effectiveness of your targeting and messaging.
Next, zoom in on the qualitative wins. Maybe you only landed one placement, but was it in a top-tier trade publication that your perfect customer reads religiously? Did you build a fantastic relationship with a key reporter that will pay dividends for years? These are huge wins.
Finally, frame the entire report around strategic takeaways. What did you learn? Did your messaging fall flat? Were certain types of journalists more receptive? This reframes a "slow" campaign into a crucial learning opportunity that makes your next effort smarter and more successful.
What's the Difference Between an Executive and a Tactical Summary?
These two summaries are for two completely different audiences, and confusing them is one of the biggest mistakes you can make. You have to tailor the message to the reader.
The Executive Summary is for the C-suite, board members, and other senior leaders. It should be one page, max. It’s ruthless in its focus on bottom-line impact. It answers one question: "How did PR contribute to our big-picture business goals?" Think big numbers, connections to revenue, and zero jargon.
The Tactical Summary is for your people—the internal marketing and PR team. It’s much more detailed and answers the question: "What worked, what didn't, and what are we doing about it?" Here, you’ll dive into message pull-through, analyze channel performance, and lay out specific, actionable recommendations to optimize the next campaign.
At Press Release Zen, we’re here to help you master every part of the communications process. From writing the perfect pitch to building a report that proves your indispensable value, our guides are built to help you succeed. Explore our full library of resources at https://pressreleasezen.com.